
Water Quality Management tools for a changing world
Our climate and natural environment are rapidly changing. Stay on top of water quality fluctuations and build resilient freshwater management plans with GybeMaps.
Monitor any surface water body.


GybeMaps is a SaaS subscription service,
combining satellite and sensor water quality data in the user friendly GybeMaps WebApp.
Much more information, without any of the hassle.
Full Coverage
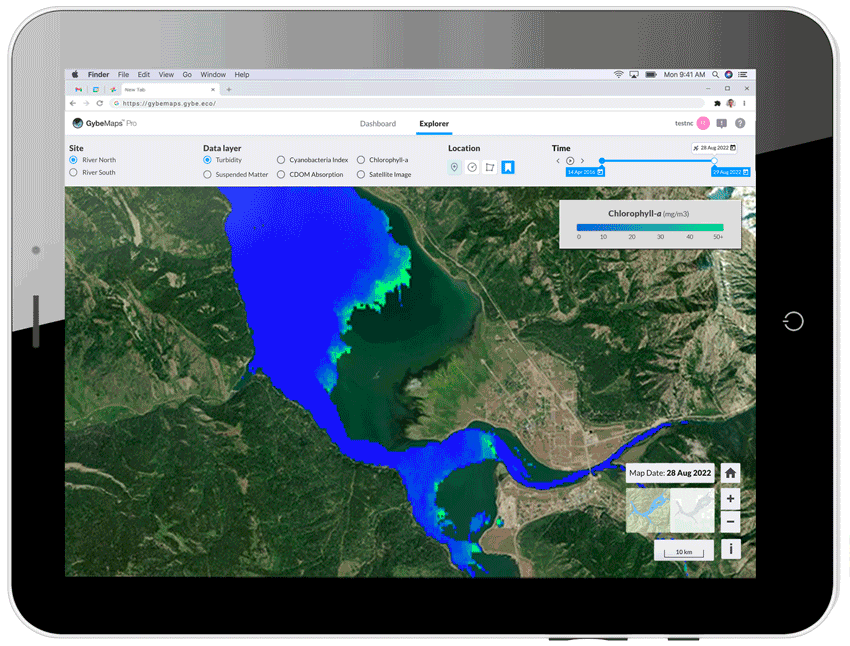
Move from local datapoints to full-coverage data maps. Our water quality maps help you track water quality across the entire waterbody: no more blind spots.
-
Uncover hotspots
-
Know where things are changing most
-
Fill in gaps from other data sources
-
Optimize your sampling


Contextualized Data
Easily differentiate between what's normal and what's unusual.
Your data is displayed in context of historical baselines, and seasonal fluctuations, making it easier to interpret the most recent datapoint,
as soon as it comes in.
Time series charts
for any location
Generate time series for any location in the waterbody, as if you had a sensor installed anywhere. Easily compare parameter values over time, within and across waterbodies.

Example Use Cases
Algal Blooms
Keeping drinking water safe by proactively tracking blooms in a source water reservoir.
Impact Monitoring
Tracking seasonal and long term changes across a portfolio of waterbodies around the world.
Nitrates in Rivers
Tracking nitrate concentrations along the Mississippi River, to the Gulf of Mexico.

DRINKING WATER UTILITIES


"“Gybe would provide additional insight into our source water quality monitoring and assessment programs. This stems from the unique ability of satellite water quality imagery to provide a system-wide view of water quality for important parameters."
- Blair Goodridge,
Section Chief, Technology and Innovation
New York City, Department of Environmental Protection


.png)
Tailored to your needs.
Everyone's monitoring needs are unique. We've built GybeMaps to make it easy to choose what works best for you.
STEP 1
Choose the location(s) to monitor
STEP 2
Choose your GybeMaps plan

The Gybe Sensor
Low Cost. High Quality Data.
Fully Automatic.
The Gybe Sensor gets you
-
Continuous data streams for 5 water quality parameters
-
Satellite data maps for two additional parameters (Cyanobacteria Index, CDOM Absorption)


Built for minimal maintenance
-
Quick and easy install, serviced by the customer or Gybe
-
Gybe monitors sensor performance
-
Gybe or the customer replaces the sensor when needed (every 12-18 months)

Key Features
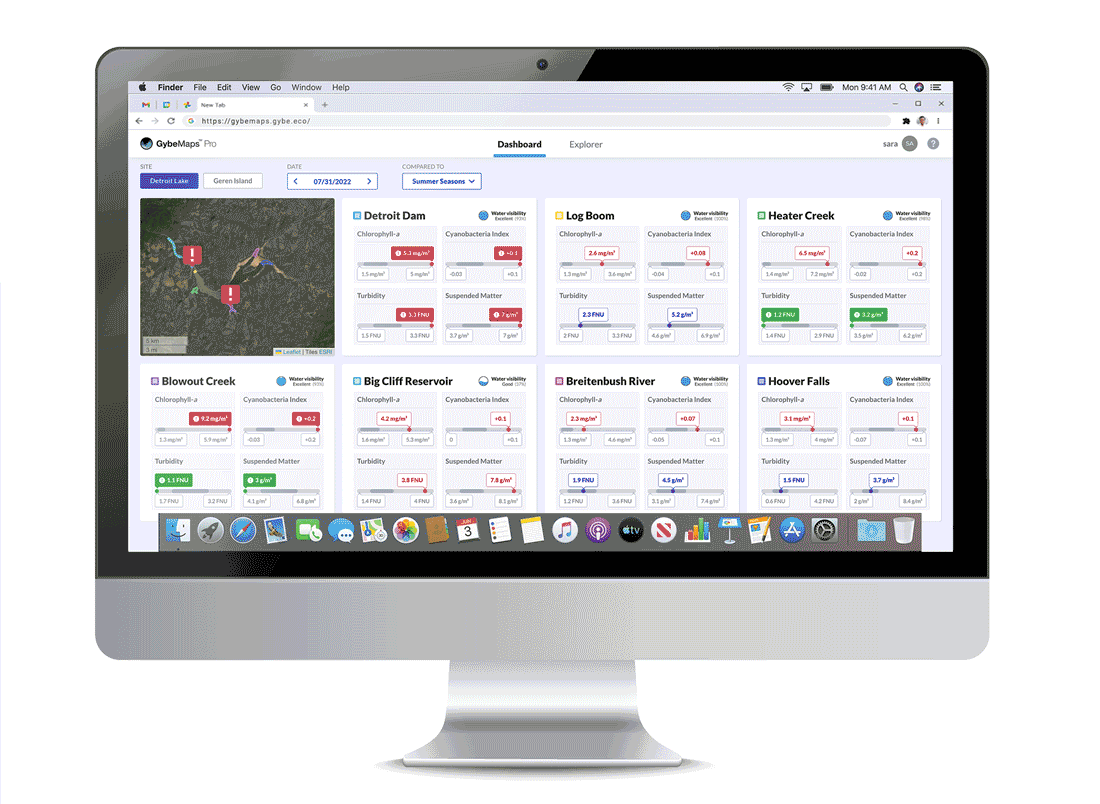
Water Quality Data Maps
Water Quality data maps and time series per parameter, derived from multiple satellites
-
Historical data back to at least 2016
-
Updated as soon as new images are available
-
Optional: Calibrate satellite data with your in situ data
Continuous Data Streams
Continuous time series from the Gybe Sensor
Operational Dashboard
Contextualized dashboard based on your areas of interest across the waterbody
Algal Bloom Predictions
For the next 7 days, updated daily.
API
Integration into SCADA systems: direct data feeds to operations and control / data systems
Many more exciting features coming soon!
Not sure if GybeMaps
is right for you?
We'll be happy to answer any questions.
Or
Set up a demo for your waterbody,
and see what GybeMaps can do for you.
Click to download the GybeMaps
product brochure